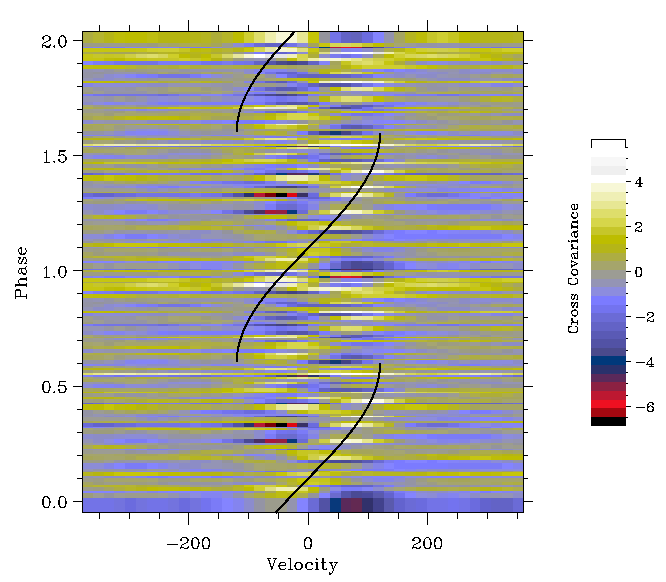
This figure shows the cross correlation between the Mega-2 spectra of HD 91969 (with the temporal mean spectrum subtracted from each spectrum) and a template of more than 100 strong Fe IV lines. The ordinate is time arranged in terms of phase with respect to the 7.7 day period seen in the wind lines and is repeated twice. The correlation is created in such a way that an excess absorption causes a positive correlation. The solid curves show the expected trajectory of a surface feature as it moves across the face of the star. Several aspects of this figure are wothy of note: