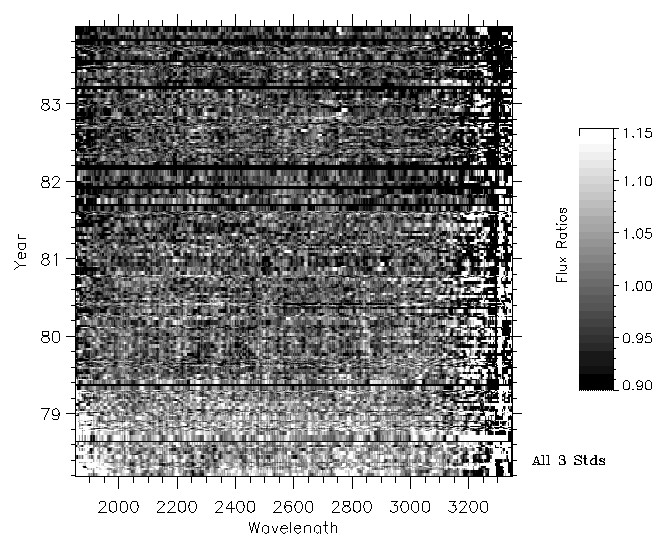

Figure 1: Time dependence of 237 LWR NEWSIPS spectra of the 3 low dispersion standards in Table 1. Each standard is normalized by its mean and then interleaved in time. The data were placed on a linear time grid using nearest neighbor interpolation, with dark gaps appearing whenever 30 days past between spectra.