Wavelength

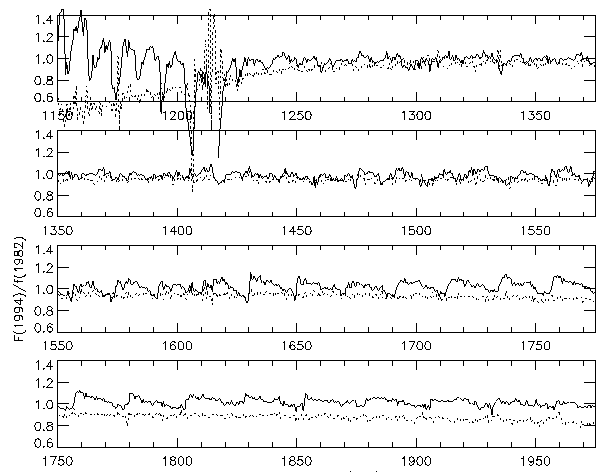
Figure 6: Time dependence of SWP NEWSIPS (solid) and IUESIPS (dashed) extractions of large aperture spectra of eta UMa. Each curve is a ratio of a 10 spectra mean obtained in 1993-94 divided by a 10 spectra mean from 1981-82 (all binned to 0.5 Å/point).