Seville
![[ADF]](adf_logo_sm.gif) Astrophysics Data Facility
Astrophysics Data Facility
From Massa et al. 1998, ESA SP-413, "Ultraviolet Astrophysics Beyond
the IUE Final Archive", eds. Wamsteker and Riestra, (ESA Pubs. Div.,
Noordwijk, The Netherlands), p723
SCIENCE VERIFICATION OF THE IUE FINAL ARCHIVE DATA PRODUCTS
D. Massa1, M.E. Van Steenberg2, N.
Oliversen1, P. Lawton1
1Hughes STX
2NASA/GSFC
Abstract
We have tested the temporal behavior and overall scientific quality of
Final Archive (NEWSIPS) extracted spectra (MXHI and MXLO files). We
utilized 1859 low and 541 high dispersion, well exposed large aperture
spectra of 6 IUE standards to perform the tests. Among other
results, we find that the low dispersion LWR data contain sizable temporal
effects (~ 10%) and that even the latest version of the SWP spectra
still contain residual time dependence shortward of Ly alpha. We also
demonstrate that the NEWSIPS error model systematically under estimates
the actual standard deviation by a small amount and draw attention to
recent results which show a 10-15% discrepancy between the NEWSIPS and
HST/FOS absolute flux calibrations. However, the largest
inconsistencies are time dependent effects seen in extracted high
dispersion spectra. NEWSIPS SWP spectra of the same object obtained 12
years apart, can disagree by as much as 40% at the shortest wavelengths,
and by 10-15% at most other wavelengths. We demonstrate that this effect
is introduced by the processing and that it was not present in the original,
IUESIPS data. The LWP data display a similar, but quantitatively smaller
effect. These results underscore the necessity of making the unextracted
data products easily accessible, so that users can apply customized
extractions as warranted.
Keywords: IUE, data analysis, NEWSIPS.
1. INTRODUCTION
As part of archiving the IUE NEWSIPS data at the Space Science Data
Operations Office (SSDOO), we are
performing a number of science verification activities in conjunction with
the IUE/NASA project. The verification is especially important for
NEWSIPS data since they were generated specifically for the archive and have
not been thoroughly examined by the user community.
To date, our investigations have concentrated on extracted, untrailed,
large aperture data from all cameras in low dispersion and the SWP and LWP
in high dispersion. Section 2 describes the low dispersion results, § 3
presents the high dispersion analysis, and § 4 is a summary.
The analysis is performed on the IUE standard stars listed in
Table 1 (Pérez et al. 1990) using standard IUEDAC software. The Table
lists the star name, spectral type, photometry, and the number of well
exposed NEWSIPS spectra used in the analyses of both low and high dispersion
data.
TABLE 1: IUE Standard Stars
| Name |
Sp Ty |
V |
(B-V) |
LWR |
LWP |
SWP |
|---|
| Low dispersion standards |
|---|
| HD 60753 |
B3 IV |
6.69 |
-0.09 |
80 |
240 |
310 |
|---|
| BD+75° 325 |
sdO |
9.54 |
-0.37 |
80 |
238 |
295 |
|---|
| BD+28° 4211 |
sdO |
10.52 |
-0.33 |
77 |
214 |
325 |
|---|
| High dispersion standards |
|---|
| zeta Cas |
B2 IV |
3.66 |
-0.20 |
-- |
98 |
100 |
|---|
| eta UMA |
B3 V |
1.86 |
-0.19 |
-- |
110 |
162 |
|---|
| tau Sco |
B0 V |
2.82 |
-0.25 |
-- |
-- |
71 |
|---|
2. LOW DISPERSION DATA
We examined the time dependence of 237 well exposed, untrailed large aperture
LWR NEWSIPS spectra of the 3 low dispersion calibration standards in
Table 1. Spectra for each standard were normalized by their mean and then
interleaved with the other standards in time. We then constructed the grey
scale representation of the data shown in Figure 1 for data obtained between
1978 and 1984, the time period when the LWR was the default long wavelength
camera. Inspection of the grey scale shows a clear time dependence in the
data for all the standards, with data from early in the mission having
larger flux values.
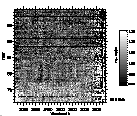 Figure 1: Time dependence of 237 LWR NEWSIPS spectra of the
3 low dispersion standards in Table 1. Each standard is normalized by its mean
and then interleaved in time. The data were placed on a linear time grid
using nearest neighbor interpolation, with dark gaps appearing whenever 30
days past between spectra.
Figure 2 shows this time dependence integrated over the wavelength band
2400< lambda < 2800Å. Each point is the mean flux across the band
normalized by the mean value for that star. It is clear that flux values
for the same source change by roughly 10% between 1978 and 1984.
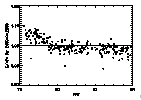 Figure 2:Plot of LWR fluxes across the band 2400<
lambda< 2800Å. Each point is the mean flux across the band
for a star normalized by the mean value for that star.
We also examined the time dependence of 930 well exposed, untrailed large
aperture SWP NEWSIPS spectra of the 3 low dispersion calibration standards
listed in Table 1. We found that even the most recent NEWSIPS spectra
(version 2.5.2 for low dispersion) still contain some residual time
dependence shortward of Ly alpha (up to 10% near the end of the
mission). Grey scale plots of the SWP data also showed that the
wavelength alignment is inconsistent, changing with time at the shortest
wavelengths. However, wavelength calibration has always been problematic
for lambda < 1250Å, due to a paucity of calibration lines.
We next turned our attention to the veracity of the modeled standard
deviations provided in the MXLO files. For each of the low dispersion
standards listed in Table 1, we determined the actual standard deviations
and compared these to the square root of the quadratic mean of the MXLO
errors. The results are shown in Figure 3. This figure shows that; the
ratios agree from one standard to the next and, the MXLO error model
systematically underestimates actual standard deviations by up to 40%.
However, this is not considered a very serious effect, since the relative
weights agree fairly well, and the distinction between 1 and 1.4
sigma is marginal in most practical situations.
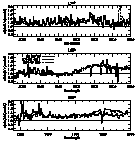 Figure 3:: Ratios of observed to MXLO modeled standard
deviations for the low dispersion standards listed in Table 1. All 3
standards are overplotted, with line styles given by the key.
We should also point out that Fitzpatrick & Massa (1998) have compared the
NEWSIPS and HST/FOS (Bohlin 1996) absolute flux calibrations and
found that they differ by as much as 15%. We emphasize that their
transformation was derived from hundreds of spectra of several blue stars
observed by both satellites, and that it is not known whether it applies
to objects with very different energy distributions.
3. HIGH DISPERSION DATA
This section presents our analysis of the high dispersion NEWSIPS extracted
spectra (MXHI files). This analysis uncovered a number of anomalies.
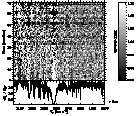 Figure 4: Time dependence of 71 SWP high dispersion NEWSIPS
MXHI spectra of tau Sco obtained over the lifetime of IUE --
only the short wavelength region is shown. The spectra are normalized by
their mean and the temporal ordinate is simply the accumulated number of
spectra.
Figure 4 shows the time dependence of 71 large aperture high dispersion
NEWSIPS MXHI spectra of tau Sco. Several aspects of the figure are worth
noting:
- Strong lines (e.g., the C III 1175 Å multiplet, interstellar Ly
alpha, and N V 1238-42 Å) all grow stronger with time.
- The regular pattern appearing in the figure is the echelle ripple,
where regions with low flux in the unripple-corrected spectra become
even lower (darker) as time passes and regions with high flux get
stronger (lighter).
- The flux in the core of the saturated interstellar Ly alpha line is
not zero, as it should be, in the mean spectrum.
Points 1 and 2 suggest a time dependent effect which depends on the flux
level of the unextracted spectra. Point 3 indicates that low fluxes are
overestimated at the beginning of the mission.
Figure 5 examines the temporal dependence more quantitatively, by comparing
the total observed changes in eta UMa and zeta Cas. This plot
demonstrates the following points:
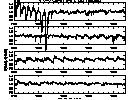 Figure 5: Time dependence of SWP NEWSIPS large aperture
extractions of eta UMa (solid) and zeta Cas (dotted). The
curves are ratios of 10 spectra means from 1993-94 divided by 10 spectra
means from 1981-82 for each star (all binned to 0.5 Å/point).
- The structure of the two ratios is identical, implying that it is a
property of the processing and not the stars.
- The ripple pattern in the NEWSIPS spectra implies that spectra obtained
12 years apart differ by 10% on average and up to 30--40% shortward of
Ly alpha.
- The systematic structure in the spectra is far greater than the random
noise. Therefore, systematic effects determine the ultimate accuracy of
comparisons between spectra obtained at different epochs.
Figure 6 Compares the time dependence of SWP NEWSIPS (solid) and the original
IUESIPS (dashed) extractions of large aperture spectra of eta UMa. The
ripple pattern in the NEWSIPS spectra is the same as in Figure 5. The
IUESIPS data do not have this problem, but they do show the signature of
instrumental degradation, which was not accounted for in IUESIPS
processing. This figure demonstrates that whatever the cause of the ripple
pattern in the NEWSIPS data, it was not present in the older extractions.
 Figure 6: Time dependence of SWP NEWSIPS (solid) and
IUESIPS (dashed) extractions of large aperture spectra of eta UMa.
Each curve is a ratio of a 10 spectra mean obtained in 1993-94 divided by
a 10 spectra mean from 1981-82 (all binned to 0.5 Å/point).
In the process of analyzing the data, we also noticed the following general
anomalies in MXHI extracted spectra:
- In very blue objects, the flux in the core of saturated interstellar
Ly alpha (which should be zero) can be as large as 10% of the continuum.
- In certain B supergiants, the flux in the cores of the strong
C IV 1550 Å wind lines can be negative by as much as
10% of the continuum.
We next examined the time dependence of high dispersion LWP NEWSIPS data.
Figure 7 is a grey scale of 110 LWP NEWSIPS large aperture high dispersion
extractions of eta UMa. As in Figure 4, the echelle ripple pattern is
apparent, except at a lower level.
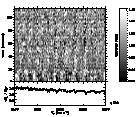 Figure 7: Time dependence of 110 LWP NEWSIPS large aperture
high dispersion extractions of eta UMa obtained over the lifetime
of IUE. Only a portion of the wavelength coverage is shown, and
the display is the same as for Fig. 4.
Figure 8 displays the LWP time dependence of zeta Cas (solid) and eta
UMa (dotted) spectra and is similar to Figure 5 for the SWP spectra. As in
Figure 5, the ripple pattern is present, but the effect is quantitatively
smaller. Additionally, as in Fig. 6, the systematic effects can dominate
the random noise.
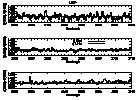 Figure 8: Time dependence of LWP NEWSIPS large aperture
extractions of zeta Cas (solid) and eta UMa (dotted). The
curves are ratios of 10 spectra means from 1993-94 divided by 10 spectra
means from 1981-82 for each star (all binned to 0.5 Å/point).
4. SUMMARY
We have tested the consistency of both low and high dispersion NEWSIPS
extracted spectra. The low dispersion spectra contain a few minor problems
which should be fairly easy to correct for by applying simple corrections
to the extracted data. On the other hand, the high dispersion spectra
contain some serious systematics which may not be so easily remedied.
The high dispersion anomalies probably result from compromises needed to
make the difficult process of echelle spectral extraction automated.
Nevertheless, they underscore the necessity of making the unextracted
data products easily accessible, so that users can apply customized
extractions as warranted.
Further details and updates can be obtained from
http://mariecurie.gsfc.nasa.gov/iue/
REFERENCES
- Bohlin, R.C. 1996, AJ, 111, 1743
- Fitzpatrick, E.L., & Massa, D. 1998, PASP, in preparation
- Pérez, M. R., Oliversen, N., Gerhart, M., & Teays, T. 1990, in
Evolution in Astrophysics,
- ed., E.J. Rolfe, ESA SP-310, p349
Web Curator and Responsible NASA Organization/Contacts
Last Updated: November 18, 1997
 Figure 1: Time dependence of 237 LWR NEWSIPS spectra of the
3 low dispersion standards in Table 1. Each standard is normalized by its mean
and then interleaved in time. The data were placed on a linear time grid
using nearest neighbor interpolation, with dark gaps appearing whenever 30
days past between spectra.
![[ADF]](adf_logo_sm.gif) Astrophysics Data Facility
Astrophysics Data Facility
 Figure 2:
 Figure 3:
 Figure 4:
 Figure 5:
 Figure 6:
 Figure 7:
 Figure 8:
 ADF IUE Homepage
 Questions/Comments